Latency vs. Learning - Balancing Speed, Quality, and Trust in EdTech

Role: Product Lead
Industry: EdTech (K-12)
This is a hypothetical scenario that illustrates my approach to problem-solving, decision-making, and product thinking. While not based on an actual project, it reflects how I would tackle similar challenges in the real world.
Context & Challenge
I’m the product lead for a rapidly growing EdTech platform used by K-12 school districts for interactive virtual learning
We were gearing up to launch a highly anticipated real-time collaborative whiteboard during live sessions
Early testers loved the interaction, but QA reported issues with loading the whiteboard in lower-bandwidth areas, especially rural schools
Engineering team proposed a fallback mode for slow networks, but it would strip out key collaboration tools (i.e. drawing layers, sticky notes, animations)

Core Decision: Do we proceed with launch as planned?
I always start with a list of key questions…
Were early testers representative of our actual customer base?
What percent of the market share are in rural, lower-bandwidth areas?
Which districts are expecting the feature next month, and what is their bandwidth profile?
Which option better supports our strategic goal of being seen as an industry leader?
Should we offer the fallback mode as an optional feature, allowing admins and educators to choose between the full suite and limited version based on their bandwidth profile?
…then, key assumptions.
> 80% of current customer base have access to high bandwidth
Theory: Rural users are less inclined to seek out high-fidelity, virtual collaboration tools as their class sizes are smaller and therefore more emphasis on manual, in person collaboration
Districts expecting full launches have access to high-bandwidth
Phased rollout will enable teams to collect additional data from a portion of the users, allowing us to incorporate feedback before features are fully accessible to all (iterative approach)
Current company goal is to establish credibility and reputation in the industry for being a leader as the goal for end of year is to expand globally
Data Needed:
% of active and target districts in low-bandwidth regions
Actual minimum bandwidth to run high-fidelity mode smoothly
Contractual rollout expectations per district
Early tester demographics vs. actual overall user base
Regression analysis results on bandwidth vs. feature stability to validate relationship and true performance threshold
My Execution Plan:
Gather any data available regarding target districts - their bandwidth profiles, customer contractual agreements, early testers’ demographics, etc.
Perform descriptive and predictive analyses on existing data
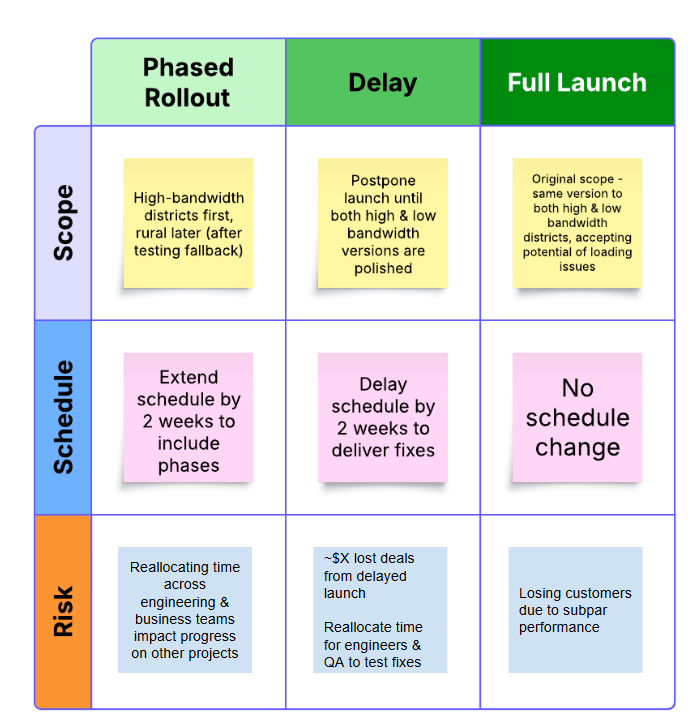
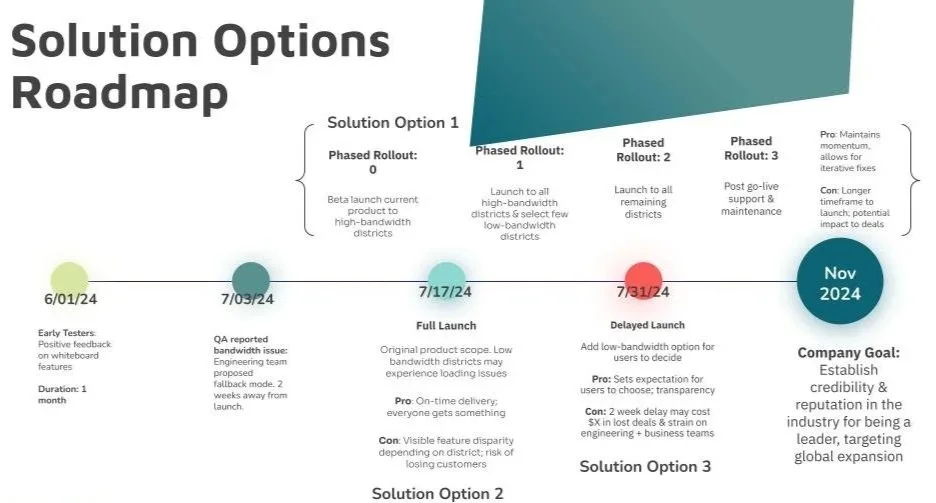
Based on analytical data, explore the benefits and risks to launching a phased rollout vs. proceeding as previously planned vs. delayed launch
Collaborate with engineering team to align on time, effort, and resources needed to launch the solution options
Review feedback from QA, business, and marketing teams, incorporating into project plan
My recommendation would be to launch high-fidelity whiteboards in high-bandwidth districts first while testing the fix for rural districts
Communicate to internal stakeholders that we’re making an intentional, phased rollout to deliver the best possible experience where the tech supports it while testing solutions for rural bandwidth limitations
This approach aligns with our industry leadership goal & keeps our delivery promises
Invite external stakeholders for feedback, communicating that the phased rollout approach allows for iterative updates based on real user feedback
Create intake process to filter through user feedback and feature requests, and to incorporate into product roadmap + development pipeline
Build and share decision log and accountability matrix to ensure alignment on decisions made, owner of item, and expected outcomes